1. 基础作图
import matplotlib.pyplot as plt

plt.axis([xmin, xmax, ymin, ymax])
#设定x轴、Y轴显示的范围
plt.plot(x_values,y_values,c='green')
#用plot函数绘制折线图,线条颜色设置为绿色
plt.title('TiTle',fontsize=24)
#设置图表标题和标题字号
plt.xlabel('X',fontsize=14)
#设置x轴标签及其字号
plt.ylabel('Y',fontsize=14)
#设置y轴标签及其字号
plt.legend(loc='best')
plt.show()
坐标轴设置
刻度
import matplotlib.pyplot as plt
from matplotlib.pyplot import MultipleLocator
plt.xticks(x,())#取消x轴刻度的显示
#从pyplot导入MultipleLocator类,这个类用于设置刻度间隔
plt.tick_params(axis='both',which='major',labelsize=14)
#设置刻度的字号
x_major_locator=MultipleLocator(1)
#把x轴的刻度间隔设置为1,并存在变量里
y_major_locator=MultipleLocator(10)
#把y轴的刻度间隔设置为10,并存在变量里
ax=plt.gca()
#ax为两条坐标轴的实例
ax.xaxis.set_major_locator(x_major_locator)
#把x轴的主刻度设置为1的倍数
ax.yaxis.set_major_locator(y_major_locator)
#把y轴的主刻度设置为10的倍数
plt.xlim(-0.5,10)
#把x轴的刻度范围设置为-0.5到10,因为0.5不满一个刻度间隔,所以数字不会显示出来,但是能看到一点空白
plt.ylim(-5,100)
#把y轴的刻度范围设置为-5到100,同理,-5不会标出来,但是能看到一点空白
plt.show()
特殊刻度
import numpy as np
import matplotlib.pyplot as plt
plt.rcParams['font.sans-serif']=['SimHei'] #用来正常显示中文标签
plt.rcParams['axes.unicode_minus']=False #用来正常显示负号
y = np.arange(0,11,1)
x = np.arange(0,11,1)
#plt.ylim((0,10))#设置x坐标轴的范围
#plt.xlim((0, 10))#设置x坐标轴的范围
plt.xticks(np.linspace(0,10,4),['大','吉','大','利'],rotation=0)
#np.linspace(0,10,4)x轴的刻度
a = ['%.2f'%oi for oi in np.linspace(0,10,4)]#Y轴的刻度标签,为字符串形式,.2f表示小数点两位
b =[eval(oo) for oo in a]#Y轴的刻度
plt.yticks(b,a)
plt.plot(x,y)
刻度向内向外
默认向外
import numpy as np
import matplotlib.pyplot as plt
plt.rcParams['xtick.direction'] = 'in'#将x周的刻度线方向设置向内
plt.rcParams['ytick.direction'] = 'in'#将y轴的刻度方向设置向内
plt.plot(x,y)
plt.show()
框线粗细
#设置坐标轴的粗细,颜色
ax=plt.gca();#获得坐标轴的句柄
ax.spines['top'].set_color('red')  # 设置上‘脊梁’为红色
ax.spines['right'].set_color('none')  # 设置上‘脊梁’为无色
ax.spines['bottom'].set_linewidth(2)#设置底部坐标轴的粗细
ax.spines['left'].set_linewidth(2)#设置左边坐标轴的粗细
ax.spines['right'].set_linewidth(2)#设置右边坐标轴的粗细
ax.spines['top'].set_linewidth(2)#设置上部坐标轴的粗细
网格
plt.grid( color = 'black',linestyle='-.',linewidth = 2)
color,marker
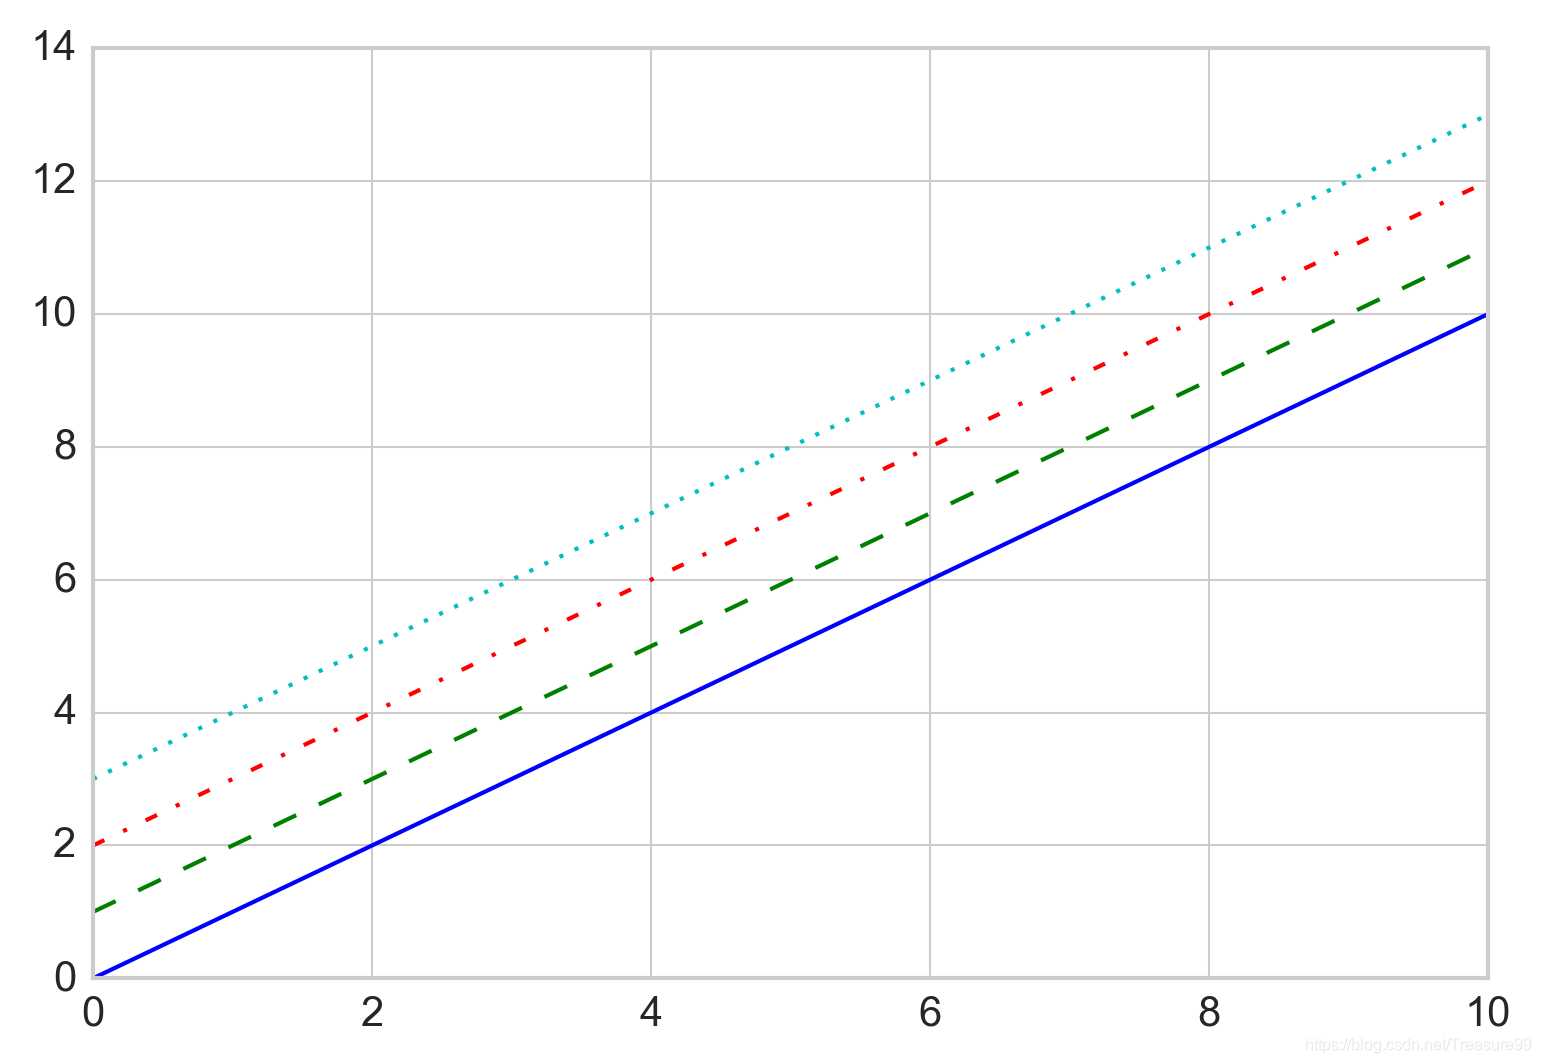
线形
‘-’ solid line style 实线
‘--’ dashed line style 虚线
‘-.’ dash-dot line style 点划线
‘:’ dotted line style 实点线
style=['-',':','--','-.']
plt.plot(X,Y,linestyle=style[i])

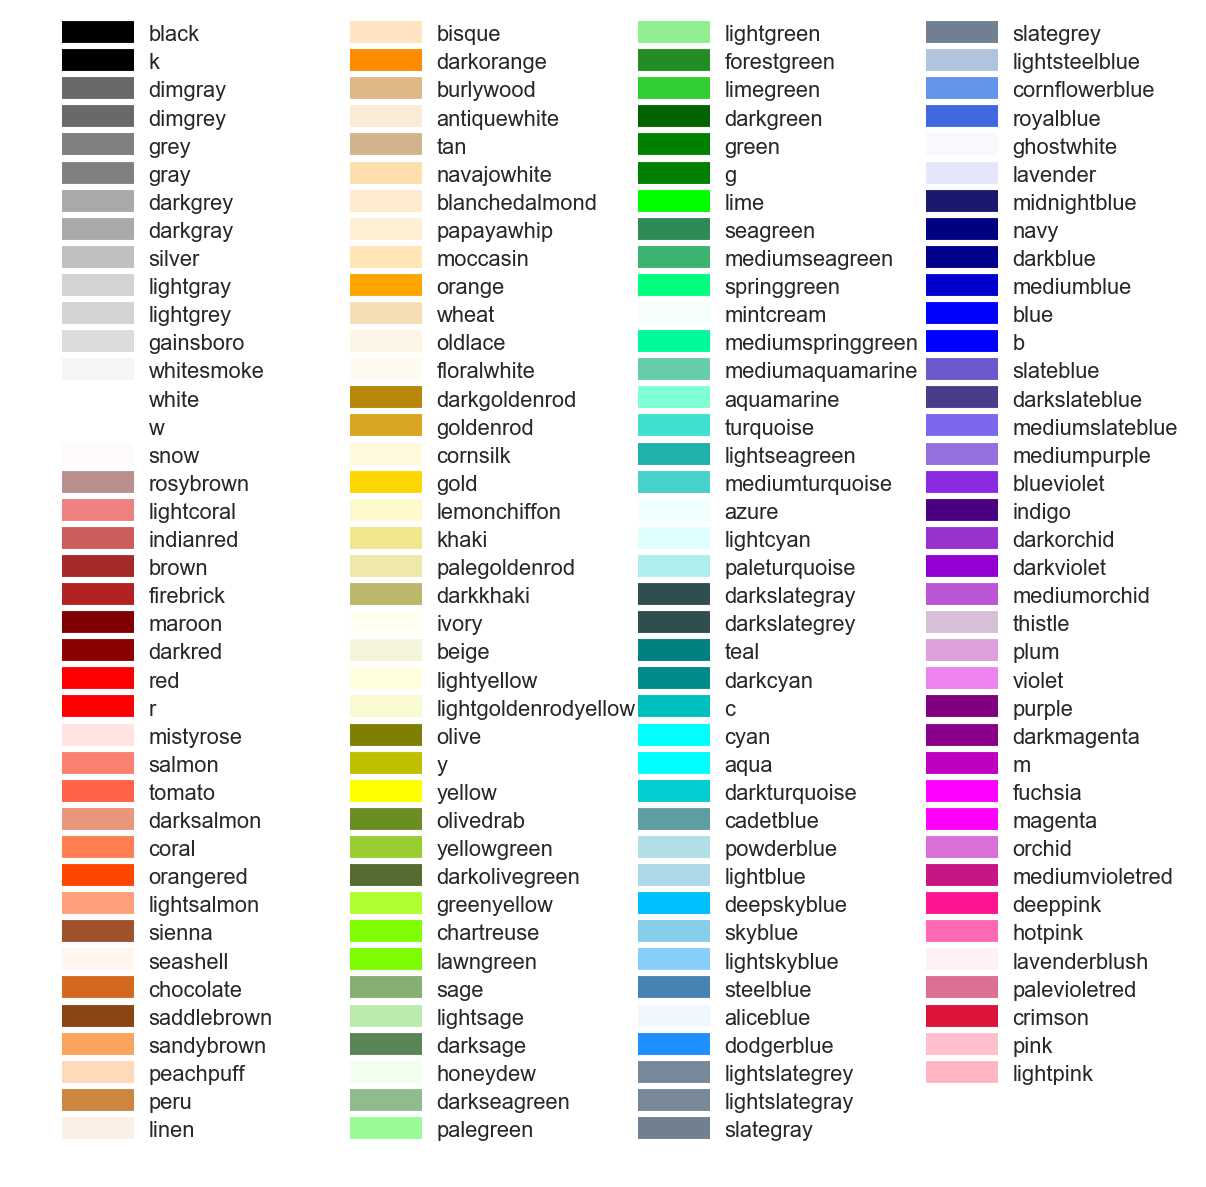
颜色
character color
‘b’ blue
‘g’ green
‘r’ red
‘c’ cyan 青色
‘m’ magenta 品红
‘y’ yellow
‘k’ black
‘w’ white 白色

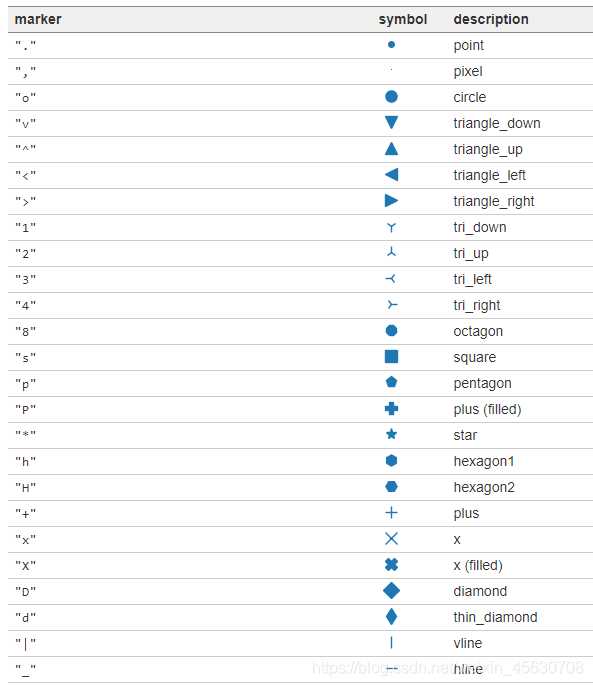
marker
mark=['.',',','o','v','^','<','>','1','2','3','4','8',
's','p','P','*','h','H','+','x','X','D','d','|','_']


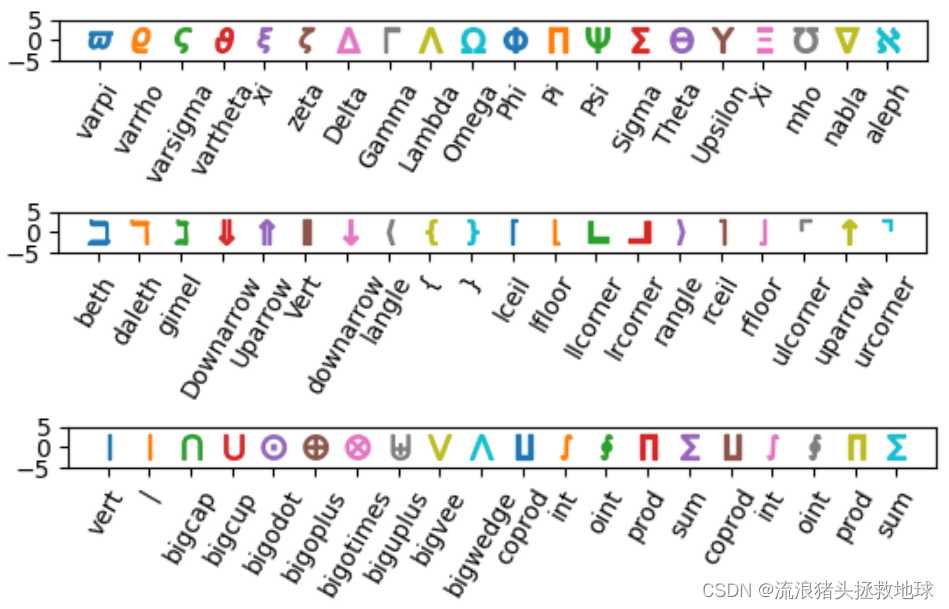
#高级marker使用marker ='$\xxx$'来调用
X = list(range(1,200,10))
Y = list(np.full(58,0))
plt.figure()
mark1=['varpi','varrho','varsigma','vartheta','xi','zeta','Delta','Gamma','Lambda','Omega',
'Phi','Pi','Psi','Sigma','Theta','Upsilon','Xi','mho','nabla','aleph']
mark2=['beth','daleth','gimel','Downarrow','Uparrow','Vert','downarrow','langle','{','}',
'lceil','lfloor','llcorner','lrcorner','rangle','rceil','rfloor','ulcorner','uparrow','urcorner']
mark=['vert','|','bigcap','bigcup','bigodot','bigoplus','bigotimes','biguplus','bigvee','bigwedge',
'coprod','int','oint','prod','sum','coprod','int','oint','prod','sum']
for i in range(20):
    str='$\\'+mark[i]+'$'
    plt.scatter(X[i],Y[i],marker=str,s=100)
plt.xticks(X,mark,rotation=60)
plt.ylim(-5,5)
plt.gca().set_aspect(1)
plt.show()


Comments NOTHING